
The Brisbane suburbs where house prices have risen and fallen the most – how does your suburb fare?
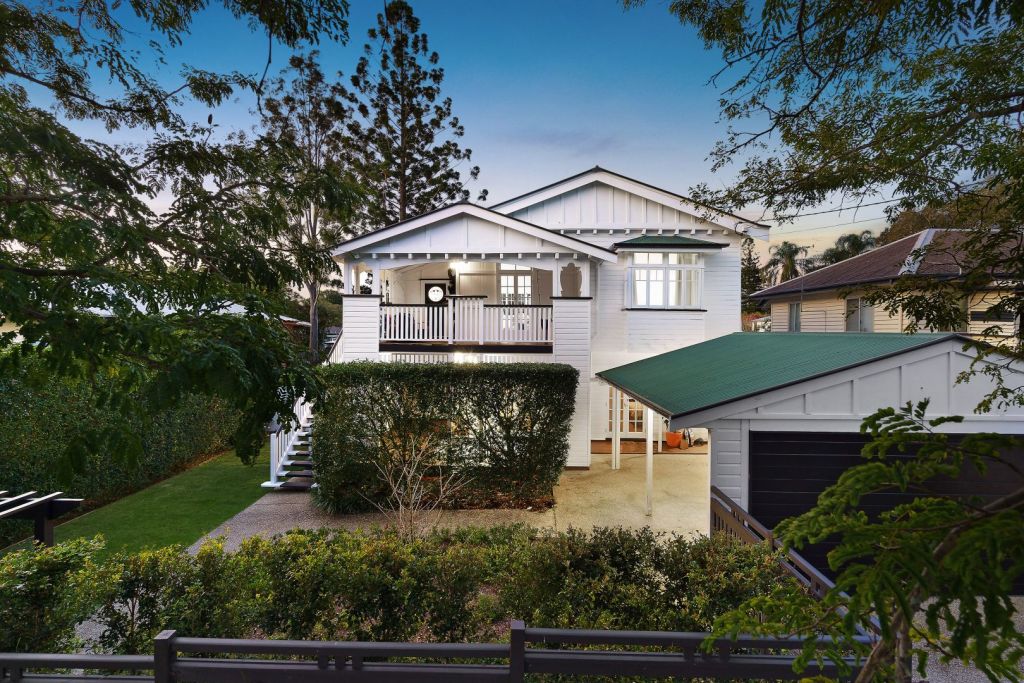
56 Hargreaves Avenue, Chelmer, Brisbane, is looking for offers over $1.95 million. Photo: McGrath Paddington
By Ellen Lutton November 29, 2022
Brisbane’s housing market may have finally succumbed to the downturn, but as for falling prices, they’ve been kept to a minimum so far, new data has revealed.
The latest Domain House Price Report showed Greater Brisbane’s median house price fell at its fastest quarterly pace on record over the September quarter, dropping by 4.3 per cent, or $36,000, from $847,374 in June to $811,312 in September.
Across the city, values edged downwards during the three months to September. Brisbane’s inner-east region lost $100,000 off its median price, while the western suburbs as a whole dropped $71,500.
Areas like Sunnybank, Mount Gravatt, Carindale and Holland Park-Yeronga also recorded some of the largest falls in median price.
| SA4 region | Sep-22 | Jun-22 | Sep-21 | Quarterly change | Annual change |
| Brisbane – East | $775,000 | $825,000 | $705,000 | -6.1% | 9.9% |
| Brisbane – North | $857,750 | $905,000 | $767,000 | -5.2% | 11.8% |
| Brisbane – South | $970,000 | $1,050,000 | $890,000 | -7.6% | 9.0% |
| Brisbane – West | $1,056,000 | $1,127,500 | $920,000 | -6.3% | 14.8% |
| Brisbane Inner City | $1,475,000 | $1,550,000 | $1,350,000 | -4.8% | 9.3% |
| Ipswich | $540,000 | $550,000 | $445,000 | -1.8% | 21.3% |
| Logan – Beaudesert | $599,750 | $607,000 | $474,000 | -1.2% | 26.5% |
| Moreton Bay – North | $677,500 | $690,000 | $565,000 | -1.8% | 19.9% |
| Moreton Bay – South | $735,000 | $750,000 | $632,500 | -2.0% | 16.2% |
Domain House Price Report, September 2022.
But Brisbane has a long way to go before all of the price gains made during the pandemic boom are erased. Domain’s data showed there is not yet a single suburb in Brisbane that has fallen in value annually; even the regions that recorded falls during the September quarter are still up over the year.
And a timeline of Brisbane’s median house price shows just how far prices have skyrocketed since the pandemic began. In March 2020, Brisbane’s median house price was just $596,152, but by March 2022 it had soared to $847,374 – that’s a massive $251,222 increase in value.
That median of $847,374, which held into the June quarter this year, was actually when Brisbane’s property market peaked. September’s price fall only brings the median back to what prices were in December 2021.
| Quarter | Median house price |
| Mar-20 | $596,152 |
| Jun-20 | $600,285 |
| Sep-20 | $609,182 |
| Dec-20 | $630,382 |
| Mar-21 | $629,727 |
| Jun-21 | $673,856 |
| Sep-21 | $715,834 |
| Dec-21 | $810,909 |
| Mar-22 | $847,374 |
| Jun-22 | $847,374 |
| Sep-22 | $811,312 |
Source: Domain House Price Report, September 2022.
Agents say next quarter’s figures are likely to reveal further falls, but those declines are simply a representation of the river city having finished its “crazy and unsustainable boom” and entered a “normal” market.
“It’s actually quite a good market, to be honest,” says Bevan Powell of Ray White Annerley. “If you look at where we were three years ago, and you look at this market, we’d take this market every day of the week.
“There are still more buyers than there are houses for sale, buyers are still motivated, but that intense competition we had is not there. In a market like this, we’re looking for one serious buyer rather than two or three that will drive the price up. If sellers don’t come down, that makes a difference. They’re making the choice – it’s up to them if they want to transact.”
Powell says prices in the south side suburb of Salisbury, where the median is up 37.5 per cent to $920,000, are now more of a mixed bag.
“Earlier this year, I was getting early $900,000s for the unrenovated post-war homes – now they’re getting mid-$700,000s for those, maybe high $700,000s. So, they’ve come down a lot. But any property that’s newer or fully done – no change at all in price. People will still pay a premium for the stuff that’s done.”
Alex Jordan of McGrath Paddington says while house prices have weakened – he estimates by about 8 to 12 per cent in the suburbs he works in around Brisbane’s inner west – the current market is not all negative.
“We’re now in the kind of market we traditionally experience in Brisbane. We just got used to the very easy market last year that was fluidly transacting, every record being broken,” he says.
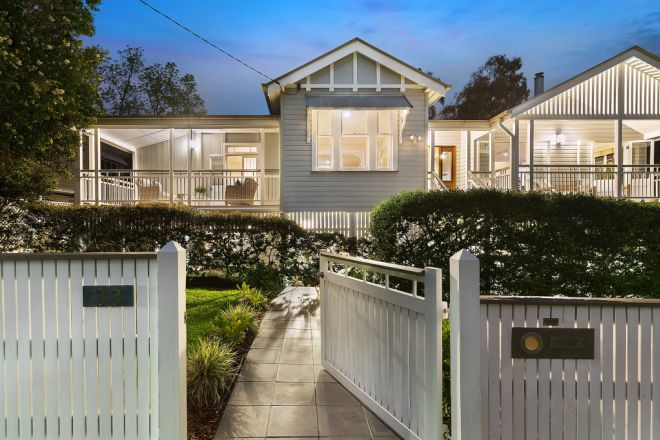
33 Spencer Street, Corinda QLD 4075
“I think it’s more of a normal market. There was a transition period that was a harder market to sell in than what it was now when interest rates were going up, and buyers were quick to catch on, but sellers were still hoping to get what they wanted before. That gap has closed, and it’s settled to a more normal market.”
The difference between the slowdown in Brisbane compared to Sydney and Melbourne’s, says Domain chief of research and economics Dr Nicola Powell, is the speed at which it unfolded.
“The slowdown in Sydney and Melbourne has happened over a longer period of time, and prices have come down in smaller increments over time,” she says. “Whereas in Brisbane, it’s been a sharp pullback. That takes time for sellers to adjust to.
“But what Brisbane experienced last year with the huge price rises was a significant change; it was a lot for people to keep up with. Earlier this year, it was very much a challenging market for buyers, and this more balanced market is much better for both buyers and sellers. It’s not leaning one way.”
The best-performing suburb in Brisbane over the 12 months to September was Newport, a coastal suburb in the Moreton Bay region about 29 kilometres from the CBD. House prices there rose by a whopping 53 per cent to a median of $1.26 million.
Agent Dianne Clarke of Belle Property Redcliffe says Newport’s housing market has slowed in recent months along with everywhere else but its fundamentals are strong and the demand from buyers is still ever-present.
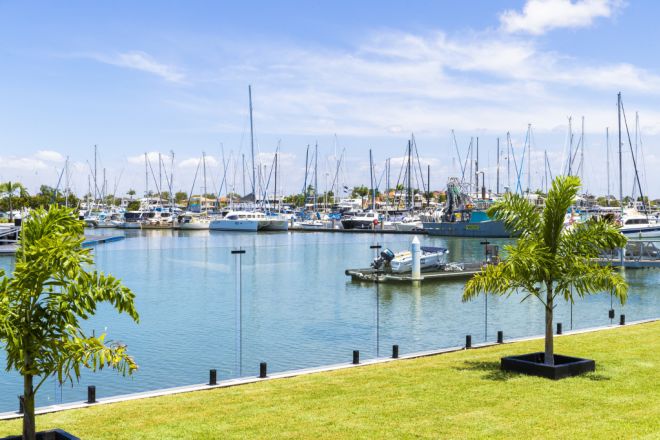
54 Australia Court, Newport QLD 4020
“What we’re experiencing now is a normal market. When I say that, I mean a normal market where you’re promoting a property, getting the buyers through, and instead of having all of that competition vying for one property and potentially those buyers offering more to secure it, now it’s a normal negotiation,” she says.
“Prices have gone up, but they’re not overpriced – and I’m saying that based on the fact it’s a new coastal area, 35 mins from the CBD and 20 mins from the airport.
“To me, what happened in Newport wasn’t a price rise; it was a price correction. If you buy anywhere around Australia this close to the CBD and water, you’re paying these prices or more. It was bound to happen, pandemic or no pandemic.”
Place Ascot agent Drew Davies says the properties that are feeling the effect of the downturn most are those that need a lot of renovating.
“That’s just a consequence of builders being hard to get and the price of materials and the logistics of how long everything takes to get,” he says.
“New or finished product is just becoming more valuable day by day; that’s a consequence of the per square metre rate to build a house that has gone up so much.”
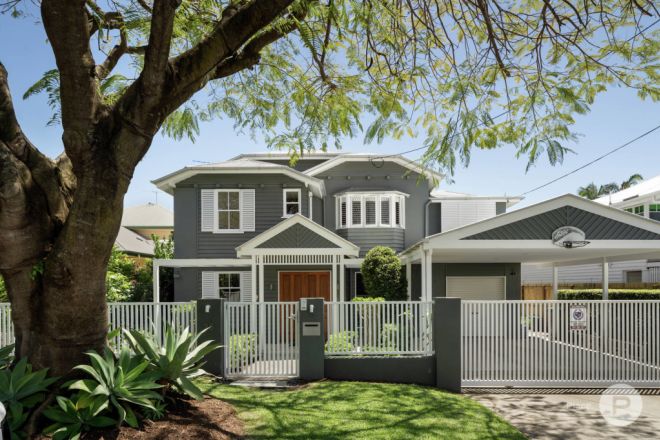
28 Bennison Street, Ascot QLD 4007
But he says Brisbane’s premium suburbs are still performing well. Ascot’s median house price grew by 37.4 per cent over the past year.
“I’ve personally run 16 auctions since September the first, and we’ve sold 13 under the hammer,” he says. “At the end of the day, if you compare the market now to 2018, this market is still red hot.
“I still feel the good news for Brisbane is strong. I feel the premium suburbs are very well protected from any economic downturn, and the figures prove that.
“At the end of the day, you cannot deny population growth. There’s a slingshot effect – the huge amount of infrastructure, the catching up we had to do. I don’t have a crystal ball, but I do feel any period of stagnation or decline we may experience is going to be short-lived.”
| State | Suburb | Median | Annual Change |
| QLD | Newport | $1,260,000 | 53.0% |
| QLD | Corinda | $1,257,500 | 47.9% |
| QLD | Bridgeman Downs | $1,200,000 | 40.4% |
| QLD | Chelmer | $1,925,000 | 40.0% |
| QLD | Woody Point | $810,000 | 39.7% |
| QLD | Acacia Ridge | $635,000 | 39.7% |
| QLD | Enoggera | $1,200,000 | 39.5% |
| QLD | Hemmant | $770,500 | 38.5% |
| QLD | Salisbury | $920,000 | 37.5% |
| QLD | Ascot | $2,500,000 | 37.4% |
| QLD | Clayfield | $1,752,500 | 36.8% |
| QLD | Rochedale | $1,450,000 | 36.8% |
| QLD | Sandgate | $1,180,000 | 36.4% |
| QLD | Stretton | $1,362,000 | 36.2% |
| QLD | Gordon Park | $1,380,000 | 36.1% |
| QLD | Holland Park West | $1,197,500 | 36.1% |
| QLD | Fig Tree Pocket | $1,793,500 | 35.4% |
| QLD | Margate | $785,000 | 35.3% |
| QLD | Boondall | $825,000 | 34.7% |
| QLD | Moggill | $900,000 | 34.6% |
| QLD | Tarragindi | $1,290,000 | 34.4% |
| QLD | Geebung | $900,000 | 34.3% |
| QLD | Wooloowin | $1,380,000 | 34.1% |
| QLD | Jindalee | $905,000 | 34.1% |
| QLD | Mansfield | $1,087,500 | 34.1% |
| QLD | Carseldine | $890,500 | 33.9% |
| QLD | Springwood | $750,000 | 33.9% |
| QLD | Carina | $990,000 | 33.6% |
| QLD | Coorparoo | $1,467,500 | 33.4% |
| QLD | Morningside | $1,122,500 | 33.3% |
| QLD | East Brisbane | $1,479,000 | 33.2% |
| QLD | Capalaba | $745,000 | 33.0% |
| QLD | Greenslopes | $1,250,000 | 33.0% |
| QLD | Eight Mile Plains | $1,039,275 | 32.9% |
| QLD | Boronia Heights | $545,000 | 32.9% |
| QLD | Victoria Point | $810,000 | 32.8% |
| QLD | Northgate | $1,020,000 | 32.7% |
| QLD | Tingalpa | $815,000 | 32.0% |
| QLD | Alderley | $1,280,000 | 32.0% |
| QLD | Chapel Hill | $1,300,000 | 32.0% |
| QLD | Narangba | $750,000 | 31.9% |
| QLD | Laidley | $360,000 | 31.9% |
| QLD | Bray Park | $675,000 | 31.8% |
| QLD | Logan Central | $448,000 | 31.8% |
| QLD | Camira | $672,000 | 31.8% |
| QLD | Burpengary | $665,000 | 31.6% |
| QLD | Windsor | $1,250,000 | 31.6% |
| QLD | Kallangur | $625,000 | 31.6% |
| QLD | McDowall | $976,500 | 31.5% |
| QLD | Annerley | $1,155,000 | 31.3% |
| QLD | Brendale | $370,000 | 31.2% |
| QLD | Kingston | $452,500 | 31.2% |
| QLD | Wavell Heights | $1,200,000 | 31.1% |
| QLD | Marsden | $542,000 | 31.1% |
| QLD | Ripley | $590,000 | 31.1% |
| QLD | Holland Park | $1,187,500 | 31.1% |
| QLD | Brookwater | $1,150,000 | 31.1% |
| QLD | Slacks Creek | $488,500 | 31.0% |
| QLD | Hillcrest | $550,000 | 31.0% |
| QLD | Logan Village | $883,500 | 30.9% |
| QLD | Redbank Plains | $481,576 | 30.9% |
| QLD | Hamilton | $2,250,000 | 30.8% |
| QLD | Morayfield | $575,000 | 30.7% |
| QLD | Coopers Plains | $856,000 | 30.7% |
| QLD | Bulimba | $1,737,500 | 30.6% |
| QLD | North Booval | $405,000 | 30.6% |
| QLD | North Lakes | $718,000 | 30.4% |
| QLD | Logan Reserve | $593,500 | 30.4% |
| QLD | Seven Hills | $1,550,000 | 30.3% |
| QLD | Everton Park | $903,730 | 30.2% |
| QLD | Parkinson | $960,000 | 30.2% |
| QLD | Shailer Park | $820,000 | 30.2% |
| QLD | Grange | $1,600,000 | 30.1% |
| QLD | Doolandella | $670,000 | 30.1% |
| QLD | Redbank | $475,000 | 30.1% |
| QLD | Rothwell | $650,000 | 30.0% |
| QLD | Deception Bay | $585,000 | 30.0% |
| QLD | Wellington Point | $975,000 | 30.0% |
Domain House Price Report, September quarter, 2022.
*This post was originally published on https://www.domain.com.au/news/the-brisbane-suburbs-where-house-prices-have-risen-the-most-whats-your-suburb-worth-1184777/