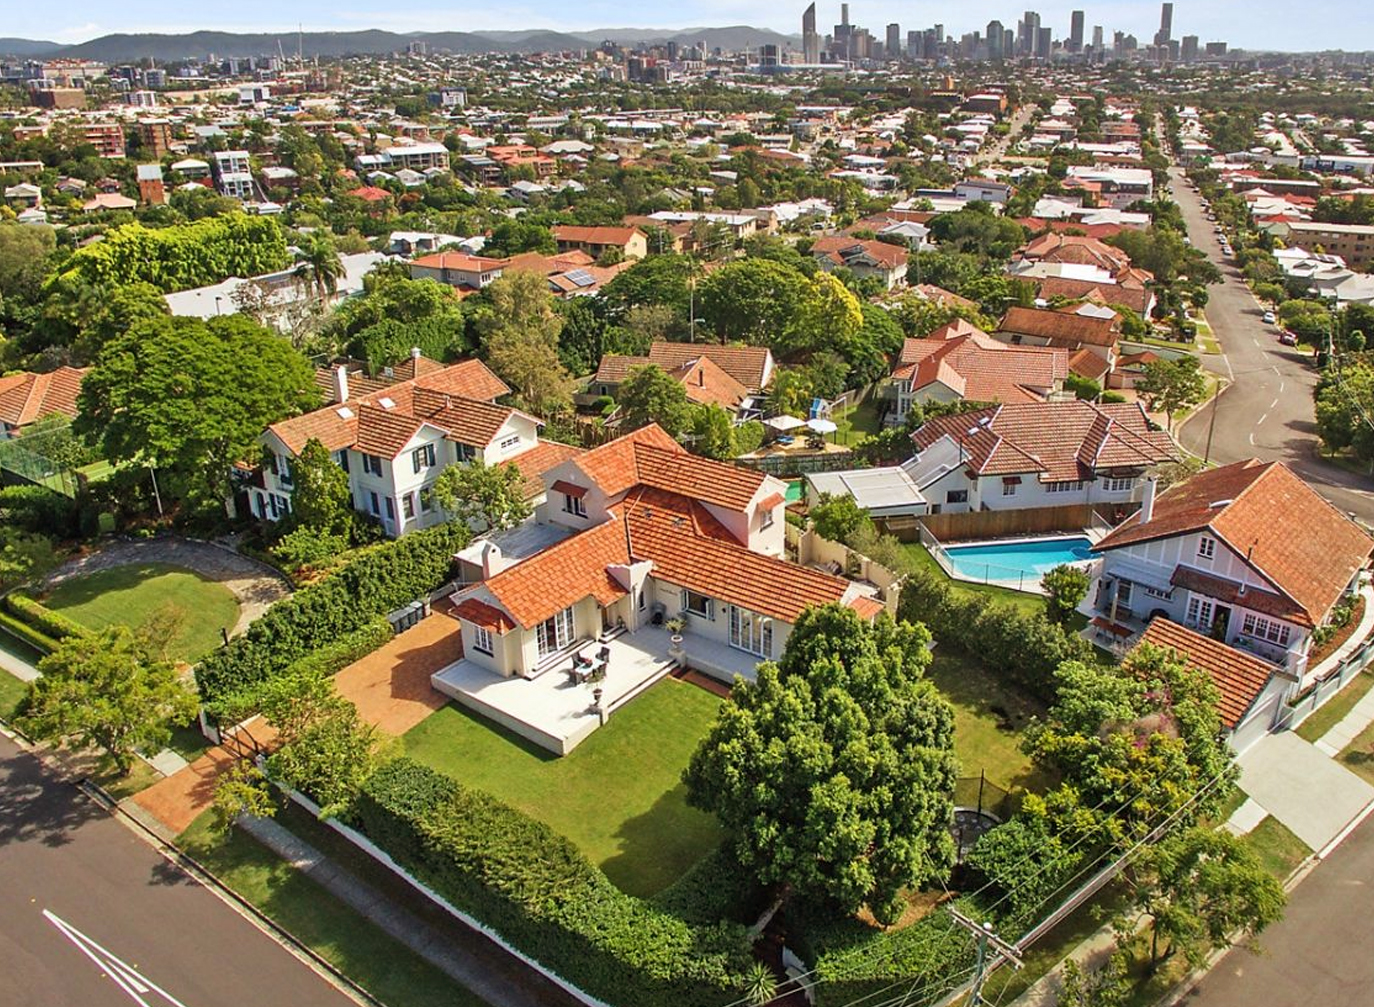
Brisbane house rents make the strongest annual gain in the city's history
Brisbane Median Rent
March 2022 QoQ Change
- House rents surged to a new record high of $500 a week following a 4.2% increase over the quarter. This is on par with the previous quarter and has resulted in the steepest annual increase on record, at 14.9%.
- Unit rents increased 2.4% over the quarter to a new record high of $430 a week. This has resulted in the steepest annual increase in almost 13 years, at 7.5%.
- Gross rental yields for units improved over the quarter suggesting rents are rising at a faster pace than purchasing prices, this is the opposite for houses.
Brisbane’s record-breaking streak continued over the March quarter with house and unit rents rapidly rising to new record highs. This is the longest period of house rental price growth and the steepest annual lift ever seen. Rents are at record highs across all Greater Brisbane areas and have risen further over the March quarter, apart from unit rents in Brisbane’s West and house rents in Moreton Bay North remaining steady. House rents continue to increase faster than units, at roughly twice the pace. This reflects the underlying demographic trends that are driving rental demand, not only from young families relocating to Greater Brisbane from interstate but also more recently those who have been displaced from their homes due to the devastating floods. It is also the need for additional space as some knowledge workers remain home-based, particularly remote workers from interstate, with tenants willing to pay a premium driving asking rents higher, particularly for those properties with a greater number of bedrooms.
The availability of advertised rentals has halved over the past year alone providing tenants little choice as supply dwindles. Brisbane remains firmly a landlords’ market with certain areas in a rental crisis. These trends are likely to continue as Queensland recorded the strongest population growth of all the states driven by interstate migration hitting a record high¹. This interest will be supercharged by the opening of international borders, eased social distancing rules, and high vaccination rates, particularly from young families seeking better affordability, lifestyle, work-life balance, and the expanding jobs market on offer in Queensland. This will create a broader demand for education and further stimulate the labour market. Investors are returning to the Brisbane market to take advantage of these competitive rental trends – this should help to slow down rent growth.
¹ ABS National, state and territory population


